Dashboard: Older People (65+) & Northern Inequality Islands
Disability is not experienced equally across England. Where you live, how old you are, and the economic history of your region all shape whether and how severely you are affected. The Census 2021 data makes that unequal distribution visible in stark geographical relief.
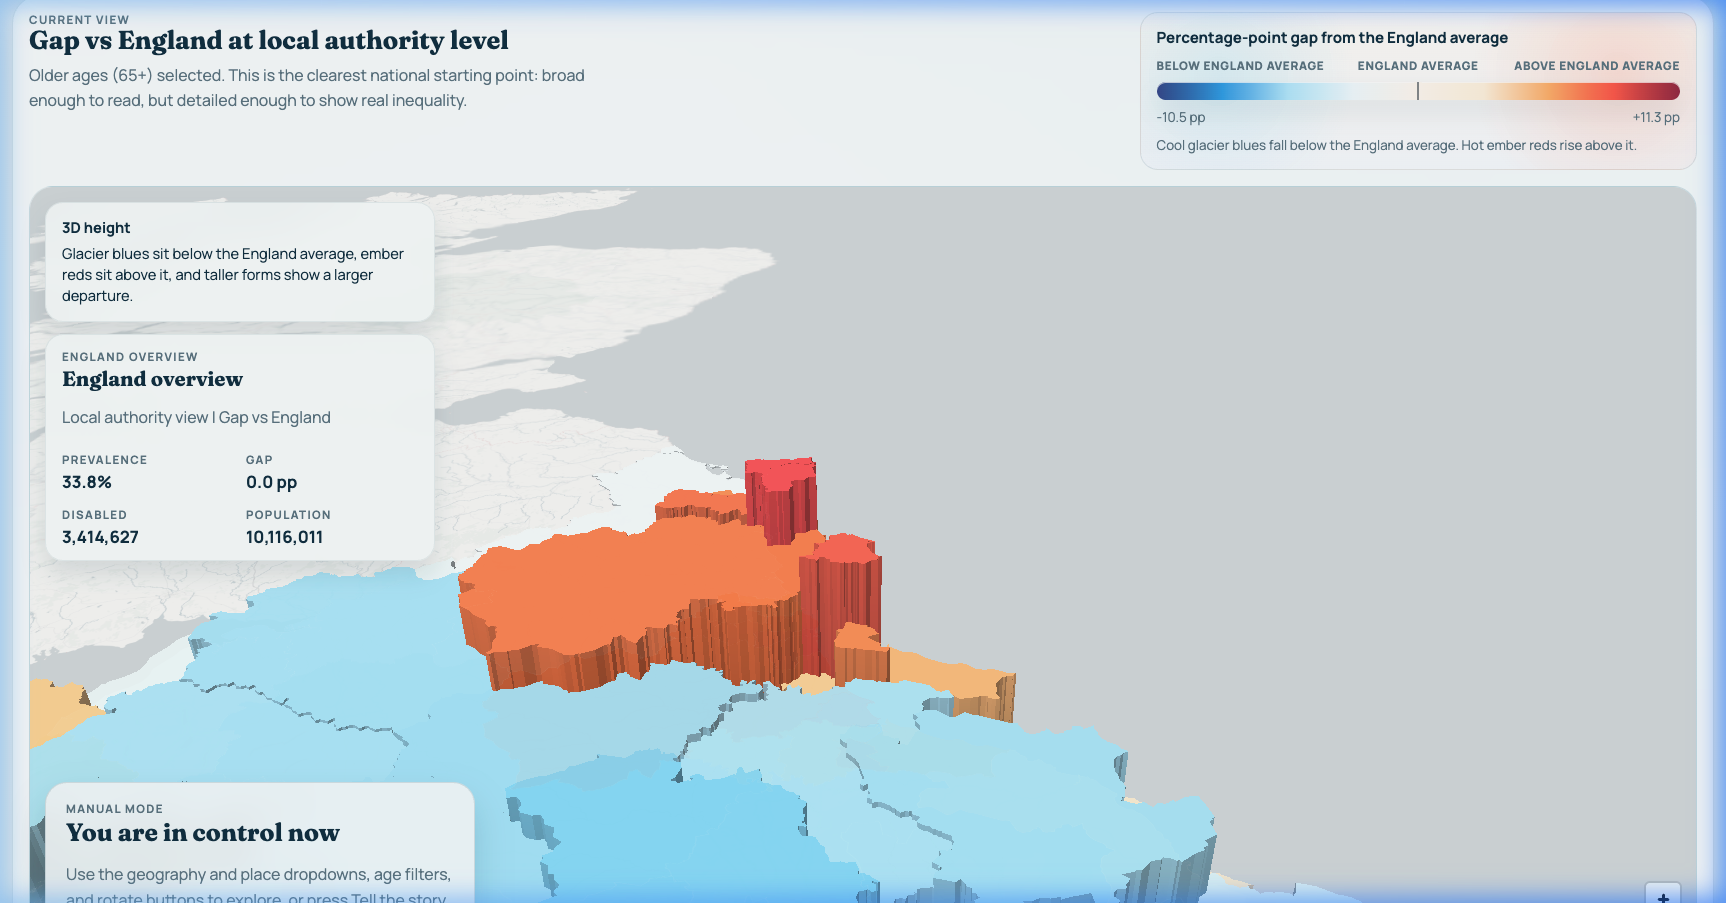
Explore the Map
A detailed geographic breakdown of the 2021 England Census detailing the inequality of disability prevalence.
View DashboardThe "Disability Inequality Islands"
When we step back and look at the national picture, about 16.9% of the population in England (approximately 9.36 million people) are classified as disabled under the Equality Act. But that single figure is a statistical mask. It hides what I call the Disability Inequality Islands, pockets of the country, primarily in the North, where disability is not just common, but endemic, and where the experience of being disabled is shaped by the compounding weight of poverty, post-industrial decline, and limited access to support.
Using the metric Gap vs England, the percentage point (+pp) difference between an area's prevalence and the national average, we can clearly visualise the disparity. These are not just spots on a map; they are isolated terrains where the social and economic architecture of health has failed, and where the burden of disability falls disproportionately on those least equipped to absorb it.
Older People: The Sharp Margin
The disparity is most aggressive among older cohorts. While national averages are useful for headlines, the reality for those 65 and over in the North East is radically different from their counterparts in the South East.
In these northern islands, the acceleration of disability with age is steeper, and the experience of that disability is qualitatively different. We are not just seeing more disabled people; we are seeing a compression of healthy life that hits harder and earlier in post-industrial heartlands, where the structural conditions that protect health were stripped away a generation ago.
The Northern Extremes
The spread of disability prevalence across the country is profound. Across all local authorities, there is a sprawling 14.0 percentage point difference between the severest concentration and the lowest occurrence.
- The Peak: The highest prevalence of disability is registered in Blackpool at 24.4% (+7.6 pp above the England average), closely followed by Sunderland, Liverpool, and Torbay.
- The Trough: At the other end of the spectrum is the City of London at 10.4% (-6.5 pp below the England average), anchored firmly within the "Glacier Blue" zone of London, which altogether rests at a region-wide 13.2%.
A Tale of Two Countries
When we pull the data up to a regional level, the disparities calcify into a familiar, brutal divide. The North East runs "hot" with a prevalence of 20.2% (+3.4 pp vs England), punctuated by extreme local concentrations over 22%. In contrast, London and the South East represent significantly diminished rates.
The 7.0 percentage point gap between the North East and London is not just a statistical artefact. It represents millions of lived experiences shaped by post-industrial legacies, age distributions, and economic disparity, and it tells us that disability in England is not one phenomenon experienced the same way by all.
Conclusion: Engineering the Terrain
The map shows us in unambiguous 3D relief that disability is not one shared experience, it is fractured by geography, age, and economic history. The "gap" operates as a clear proxy for broader regional disparities, and the data makes clear that where you are born shapes not just whether you become disabled, but when and how severely. To close that gap, policy has to target the terrain where the disparities are deepest, confronting the "Ember Reds" with focused support. This is exactly the kind of deep epidemiology consultancy work I undertake to support public health and commercial strategy.
We need to look at these inequality islands not as anomalies, but as the front line of our national health crisis.